



A company was looking at its space needs. The badge data showed people coming into the office. So it spent a million dollars updating the space around those numbers.
Then the office sat nearly empty.
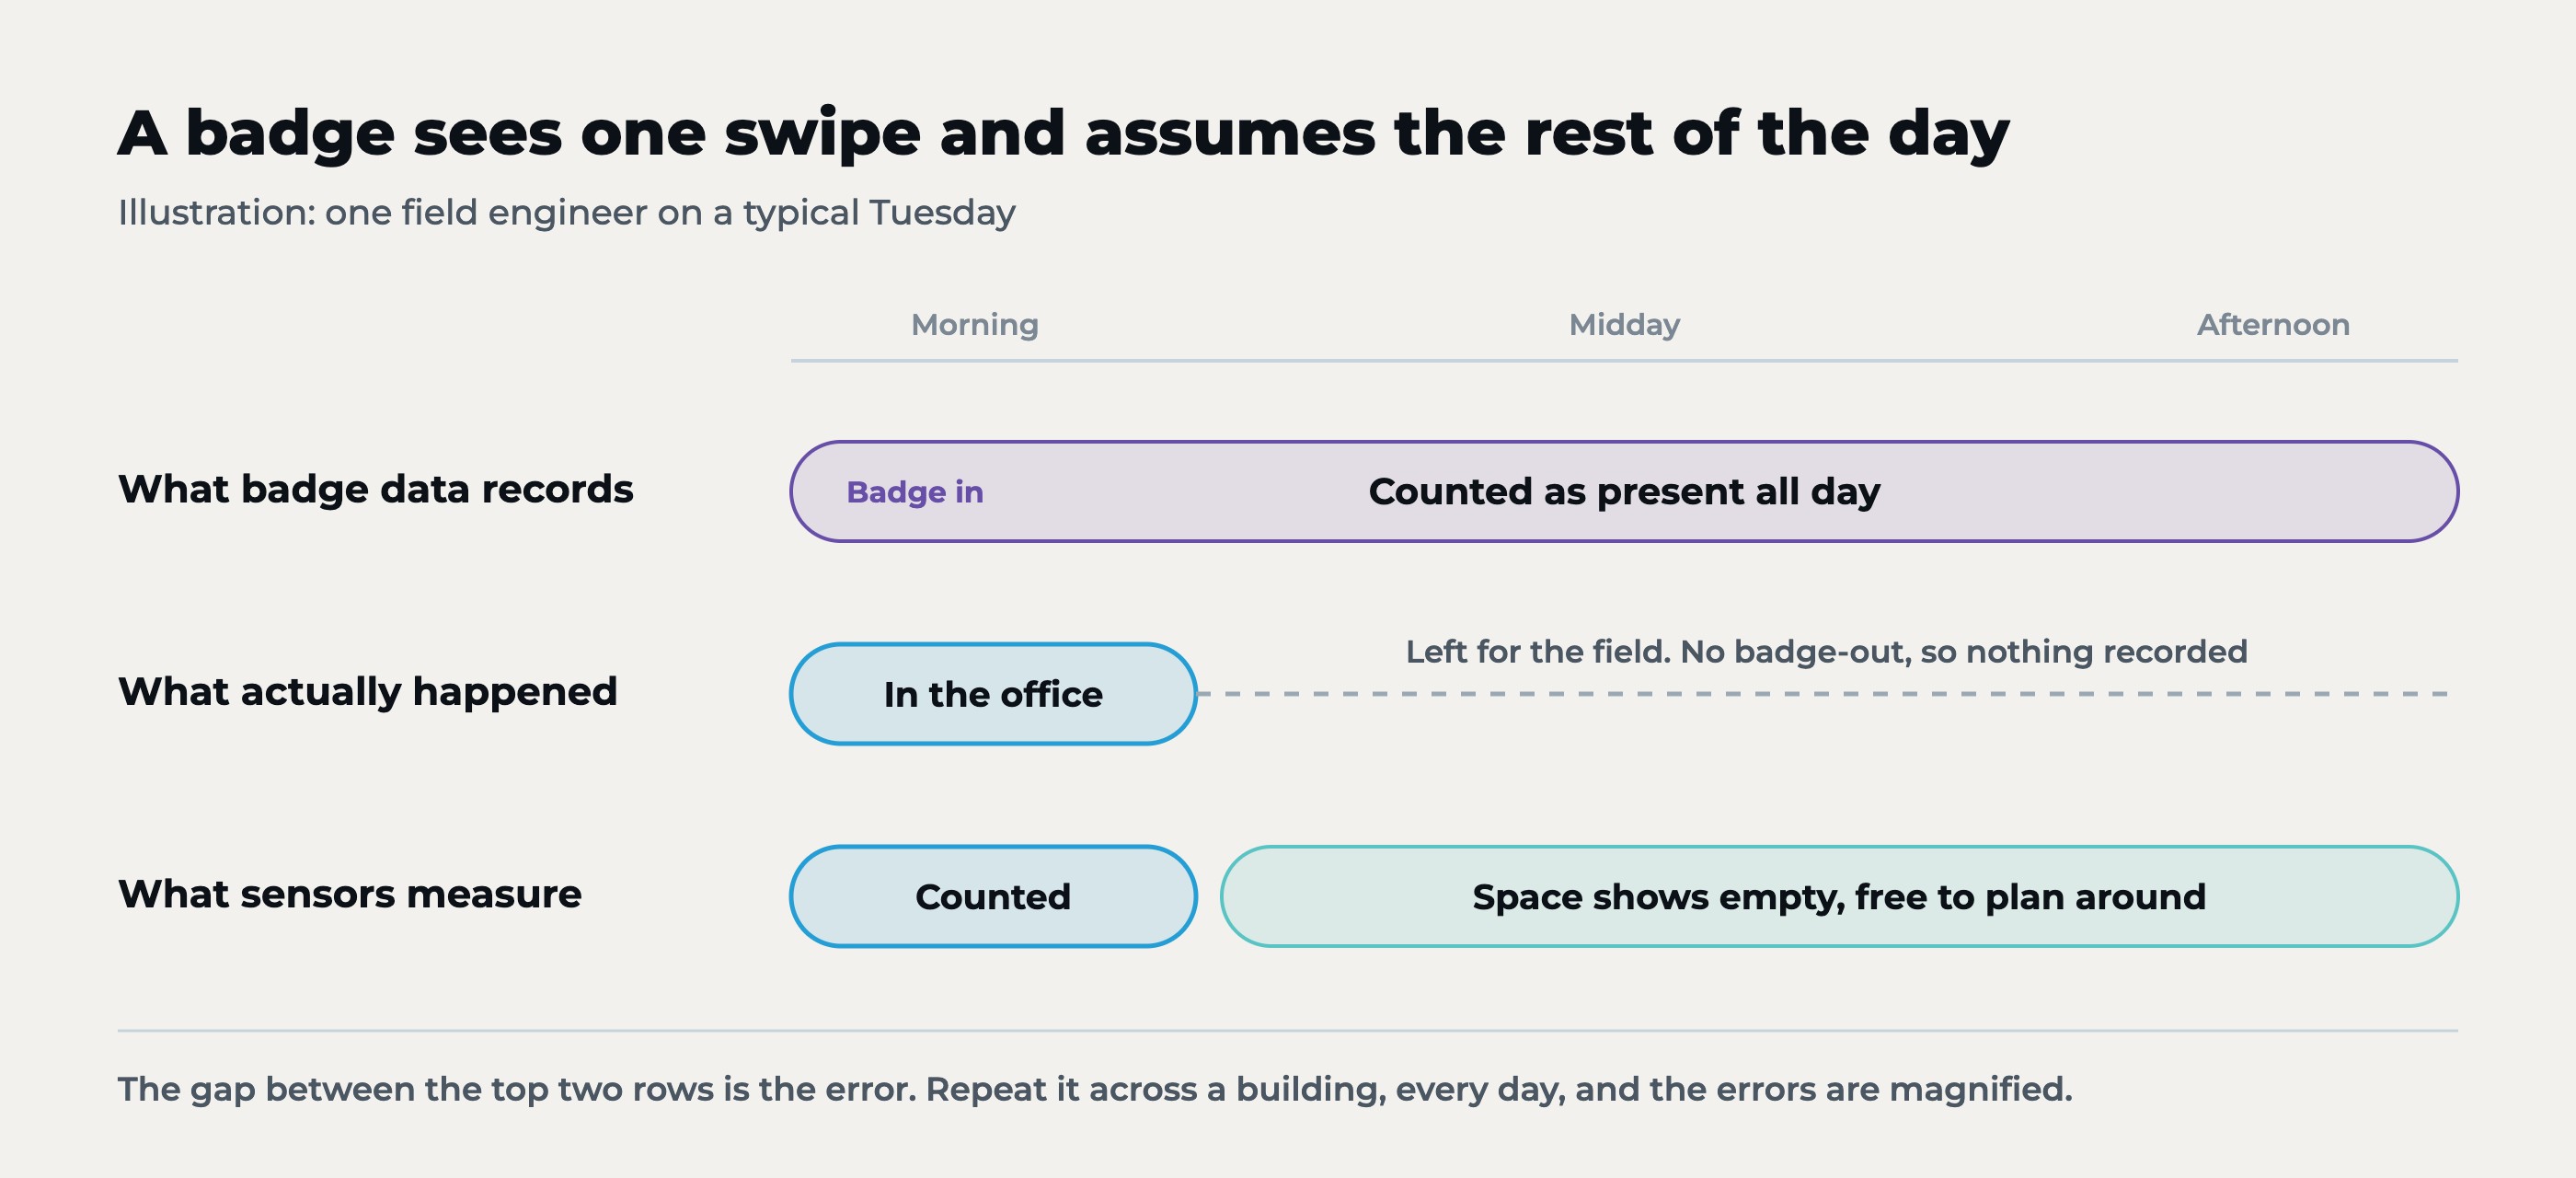
Many of the people swiping in were engineers. They came in early, badged through the door and left for the field. The badge system recorded every arrival, but had no way to record a single departure. And right around the corner, the company had another office it could have used instead.
Melissa Michalik, Global OPM Operations Leader at JLL, told that story on our recent Bisnow webinar, The State of Office Space Utilization and Optimization. Her occupancy planning team works with corporate occupiers around the world.
Her verdict on badge data:
“If you’re using badge data solely to understand your utilization, you stand to make some big errors.”
JLL’s 2026 Global Occupancy Planning Benchmark found that 92% of organizations use badge-swipe data to understand occupancy.
The same report found that only 7% rate their data capability as excellent.
As Enid Maran, Occuspace’s Head of Customer Success, put it on the webinar:
“Not a lot of people are loving their current state of data.”
So why does badge data still drive decisions? Usually because it’s already there, and because it feels close enough. It’s “directional,” the thinking goes.
Occuspace CEO Nic Halverson put the problem plainly on the webinar:
“Nobody thinks badge data is that accurate or that good, but they kind of default to, well, this is what I have.”
Then they make multi-million-dollar decisions with it.
A badge reader was built to answer one question: should this person get through this door? Utilization is a different question entirely – how many people are using which spaces, when, and for how long.
Here’s what a badge swipe can’t tell you.
And before any of it can be used at all, badge data has to be scrubbed of duplicates, denied swipes and reader errors.
Badge data is useful for what it was built for: security and attendance. It is not a measure of how space is used.
For a closer look at how badge data skews portfolio decisions, see Tony Josipovic’s Beyond Badge Data: How Utilization Sensors Are Reshaping Portfolio Optimization.
The usual defense of badge data is that it’s directional. Maybe it overcounts, but discount it and you’ll get close enough.
We tested that. For one client, we put daily badge counts side by side with measured peak occupancy.
In a single week, badge counts ran 60% above peak occupancy on Tuesday and nearly 100% above it two days later. In a second building that same week, the Thursday gap was 11%.
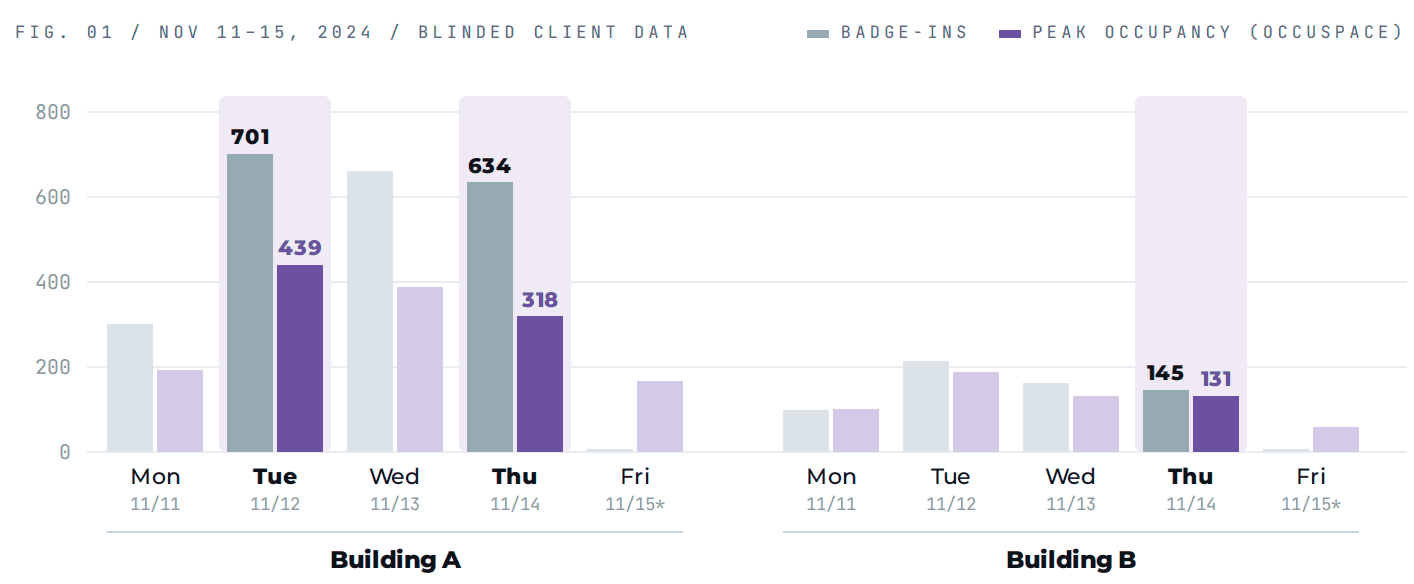
That’s the real problem with “directional” data. The error isn’t a constant you can correct for. As Enid put it on the webinar:
“There’s just no sort of rule of thumb that you can apply to badge data to say, okay, let me just use badge data and shave off 25%, and we’re good.”
A compass off by a fixed ten degrees is still useful. A compass off by a different amount every day is just a guess.
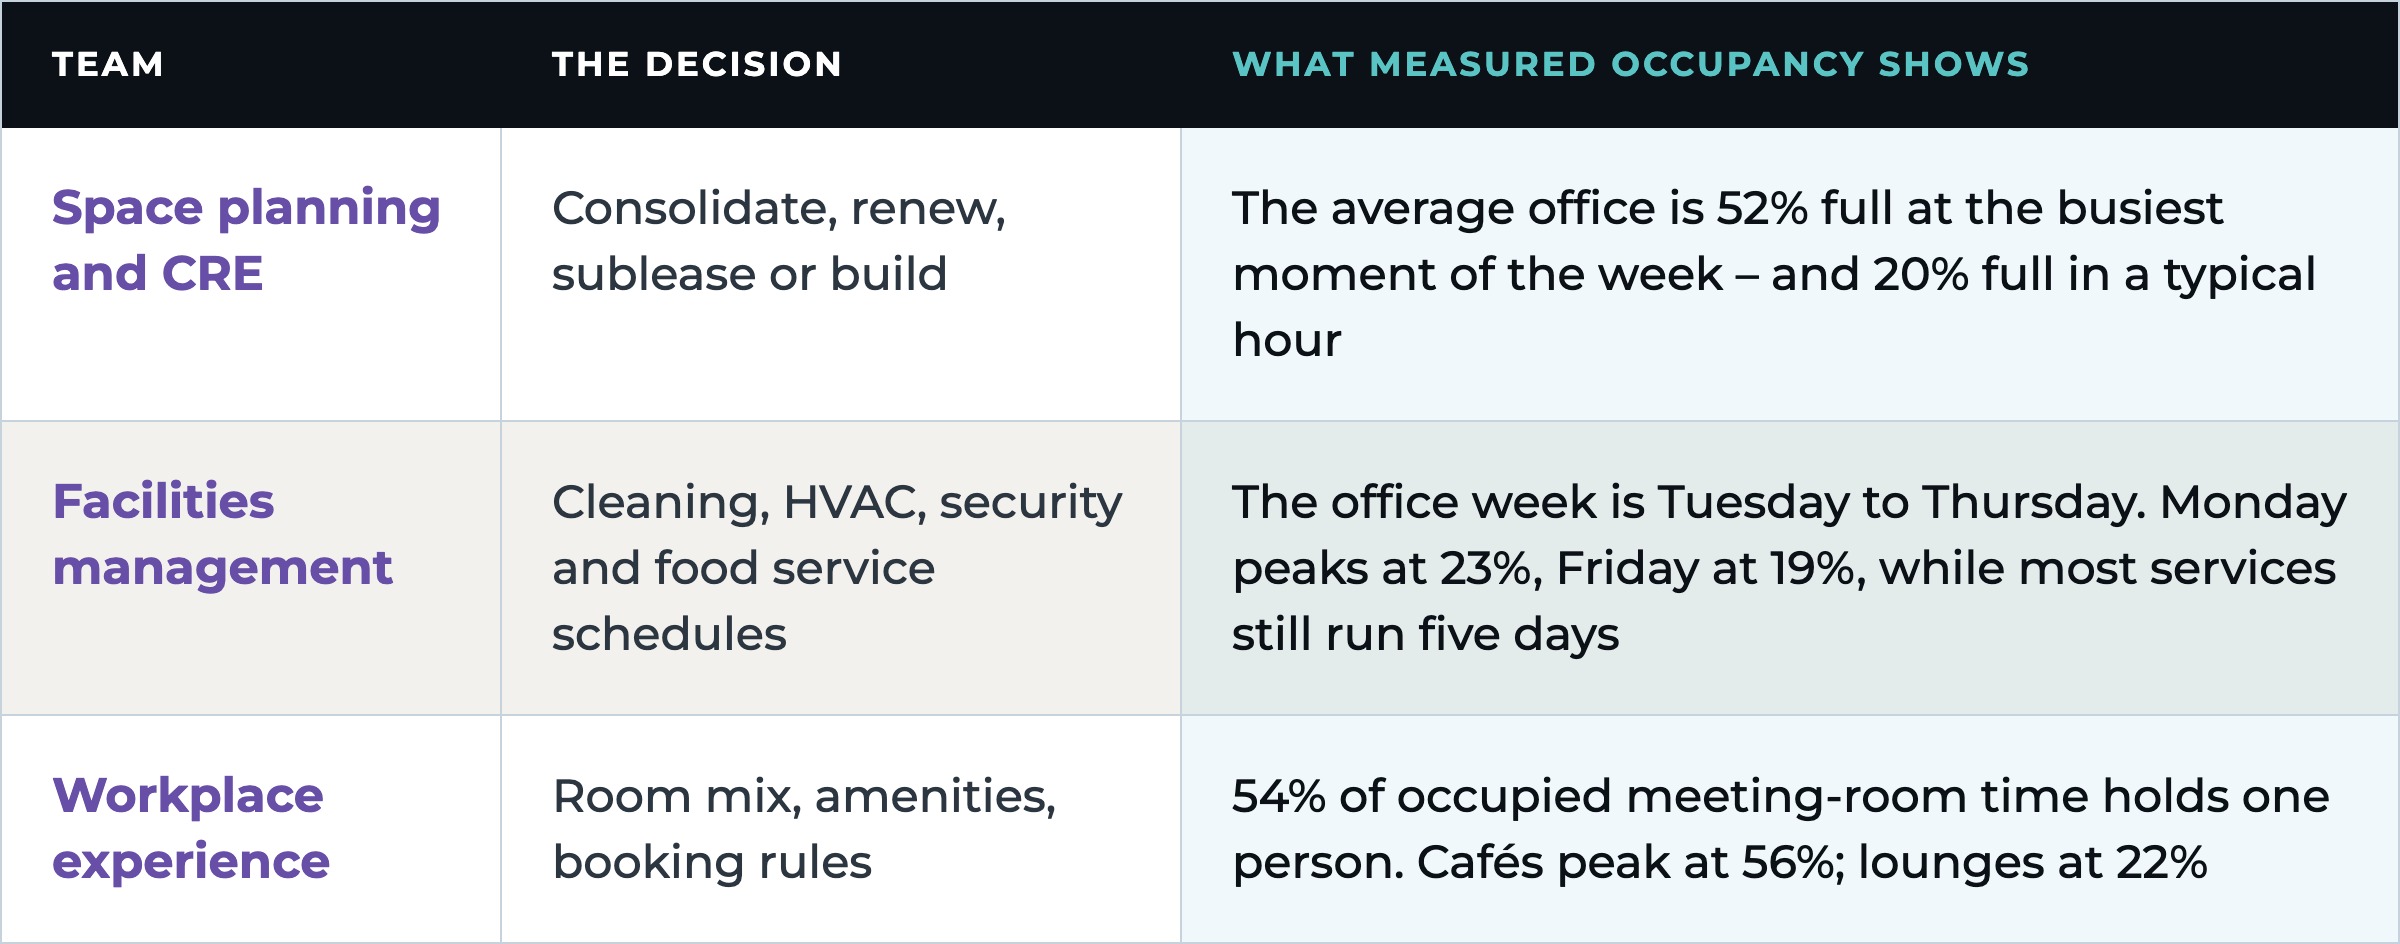
Every team that touches space is making a decision badge data can’t support. The figures below are the ones Enid walked through on the webinar, from Occuspace’s Space Utilization Index for H1 2026, built on measured data across more than 50 million square feet. They’re benchmarks, but show the kind of question measured occupancy can answer, and badge data can’t.
There’s a fourth consequence that cuts across all three. Leadership is telling CRE and facilities teams to use AI, and AI amplifies whatever you give it. As Occuspace CIO Linus Grasel explained on the webinar, a model will “take in badge data, take in your peaks, and make the wrong decision.”
Melissa’s follow-up:
“If the data’s not clean and it’s flawed, you’re going to make some errors, and those errors cost lots of money.”
Real estate is typically the second-largest expense an organization carries, after people. A bad number in a space plan is never a small mistake.
Take a 500,000-square-foot portfolio. Your rents and build costs will differ, but the shape of the math won’t:
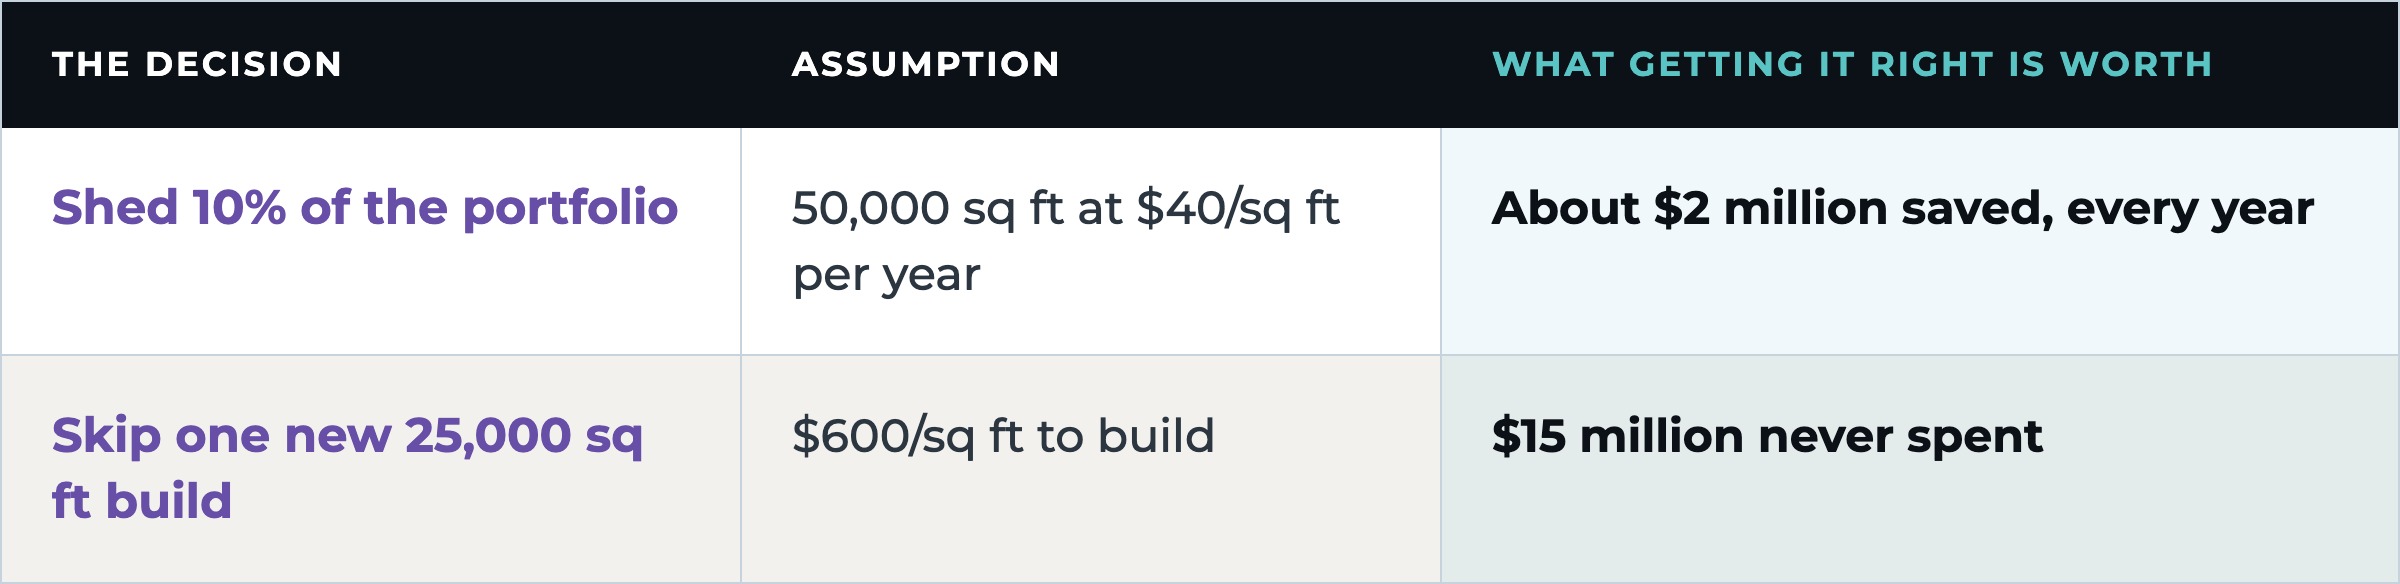
Melissa has seen what happens when organizations get real data. On the webinar she described the savings her occupancy planning team has delivered for clients, counting square footage alone, as running into the hundreds of millions.
“If you do it right, you’re going to save millions.”
And the savings don’t stop at lease and construction costs. The same occupancy data can right-size cleaning routes, HVAC schedules and food service. One large Bay Area tech company uses Occuspace to plan its free employee lunches; it cut food waste by more than 20%, which on its own returns more than twice what the company spends on Occuspace.
If badge data is this unreliable, why do so many teams stick with it?
We asked the webinar audience. The leading answer was that the alternatives seemed too expensive or too hard to deploy. Later in the session, a third of respondents named cost and building the business case as what kept them from using space data.
Melissa’s response:
“If you’re not spending the money to understand your space data, you’re gonna lose a lot. A lot. It’s every square foot that you’re paying for, whatever that is, $500 a square foot, on top of your operating expenses, all that wasted square footage. When you look at it against what you would spend to put in the right tools, it’s a drop in the bucket. It really is.”
Her advice for building the case is just as simple: take the cost of the tool and set it against the space you’ll save by using it.
That’s the trap in calling badge data “good enough.” It feels free because you already have it. But a free number that sends a million-dollar decision the wrong way is the most expensive data you own.
The idea that accurate occupancy data requires a long, expensive rollout is out of date. Here’s what getting started with Occuspace looks like.
Privacy is built in. Occuspace counts how many people are in a space, never who. There are no cameras, and we collect no personal information of any kind.
The economics fit too. Hardware is leased rather than bought, and pricing is by the square foot, so you can start with one building and expand once the data proves itself.
And you don’t have to throw away the badge data. Keep it for what it does well: security and attendance.
If you’re still relying on badge data, three questions to take back to your team:
If any of those answers made you uncomfortable, start small. One building. Ninety days. One decision – backed by data you can trust.
Book a demo to see what your space is really doing, or watch the full Bisnow webinar with JLL for the complete conversation.


