Read More
Solutions

Stop Guessing. Start Knowing.

You wouldn't drive with a muddy windshield. So why steer million-dollar space decisions with murky, incomplete data? Occuspace shows you exactly how your buildings get used, so you can decide with facts. In any industry.
The Solutions

What Occupancy Intelligence Delivers

1

Space Optimization

Reduce operating costs by optimizing HVAC, custodial services, maintenance, and other building operations based on real-time occupancy.
Learn more →

2

Operational Efficiency

Improve efficiency by aligning building operations and resources with actual space usage.
Learn more →

3

Capital Planning

Prioritize investments, optimize portfolios, and make confident long-term real estate decisions.
Learn more →
One Data Layer

Where the Data Pays Off

One sensor network. Three ways it earns its keep.

Smarter Space Decisions

Right-size what you lease, own, and build. Give teams the space they actually need. Fix the meeting room mix.

Lower Operating Costs

HVAC, cleaning, and food all scale with people. Run them on real headcounts and the savings show up fast.

A Head Start on AI

AI is only as good as its data. Start building the deep, accurate usage history your models will need.

1

Space Optimization

Make sure every square foot delivers value.
Right-Sizing

Renew, Reduce, or Build. With Proof.

The big money moments in real estate get decided early. A lease renewal. A consolidation. A new building. Continuous usage data tells you what you actually need before you sign anything.
Utilization by building, floor, zone, and space type
Peak versus average occupancy, so you size for reality
Know what to consolidate, sublease, or not build at all
The Cost of Guessing

Most Space Sits Empty. Most Budgets Assume It's Full.

Here is what the measured data keeps showing.
45%

Average campus utilization

Occuspace's Fall 2025 Space Utilization Index, measured across 40+ million sq ft on 100+ U.S. campuses. The target is 70%.
$79B

Spent yearly on unused space

What U.S. higher education alone spends each year on space nobody is using, per the same index.
69%

Conference room use by one person

The share of measured conference room usage that involved a single occupant. One person, in a room built for a crowd.
25-40%

How far badge data is off

How much badge-only occupancy estimates miss by, compared to measured presence. Guesswork built on bad inputs.
Workplace Strategy & Design

Hybrid Broke Assigned Seating. Data Fixes It.

Attendance now swings by team and by day, and fixed seat counts can't keep up. Occuspace shows how each team really uses space, so you can set neighborhoods and sharing ratios that hold up in practice.
Utilization and dwell time by team zone
Seat-sharing ratios based on real attendance
Before-and-after data for every pilot
Meeting Rooms

Most Meeting Rooms Are the Wrong Size

Occuspace research finds that small and medium conference rooms sit empty 73% of the work week, while the average meeting uses only 33% of available seats. With three to four people representing the most common meeting size, our real-time occupancy data reveals whether your room mix matches actual demand.
Booked versus actual use for every room
Attendance versus capacity by room size and type
Opportunities to resize, redesign or repurpose space
Neighborhood & Team Planning

Plan Neighborhoods Around How Teams Actually Work

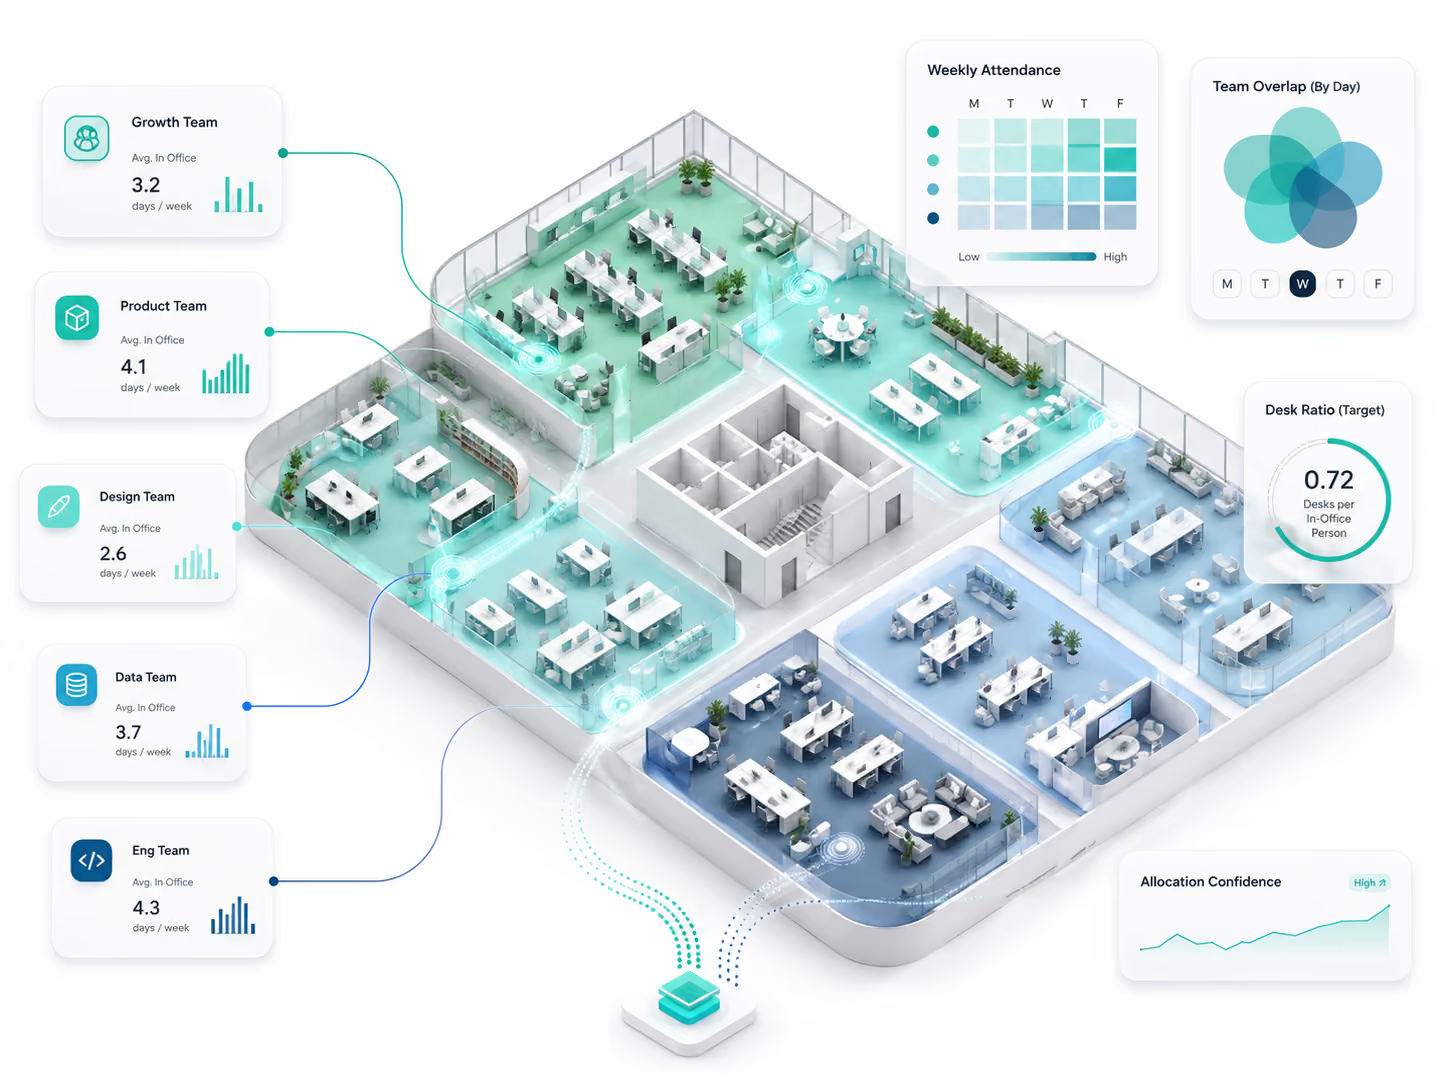
Hybrid schedules mean attendance changes by team and day. By measuring utilization across team-assigned neighborhoods, Occuspace shows when and where demand is highest – helping you allocate space and set desk-sharing ratios based on actual use.
Utilization by neighborhood and day of the week
Peak demand and overlap across team-assigned spaces
Desk-sharing ratios and hybrid policies backed by evidence
“ Now that we have live data on the use of our spaces, we can evaluate building utilization based on occupancy over time. This way, we can determine strategies to optimize space and deliver the right working and learning environments. ”
UC San Diego

2

Operational Efficiency

Reduce operating costs and improve building performance.
Operational Savings: HVAC

Stop Conditioning Empty Rooms

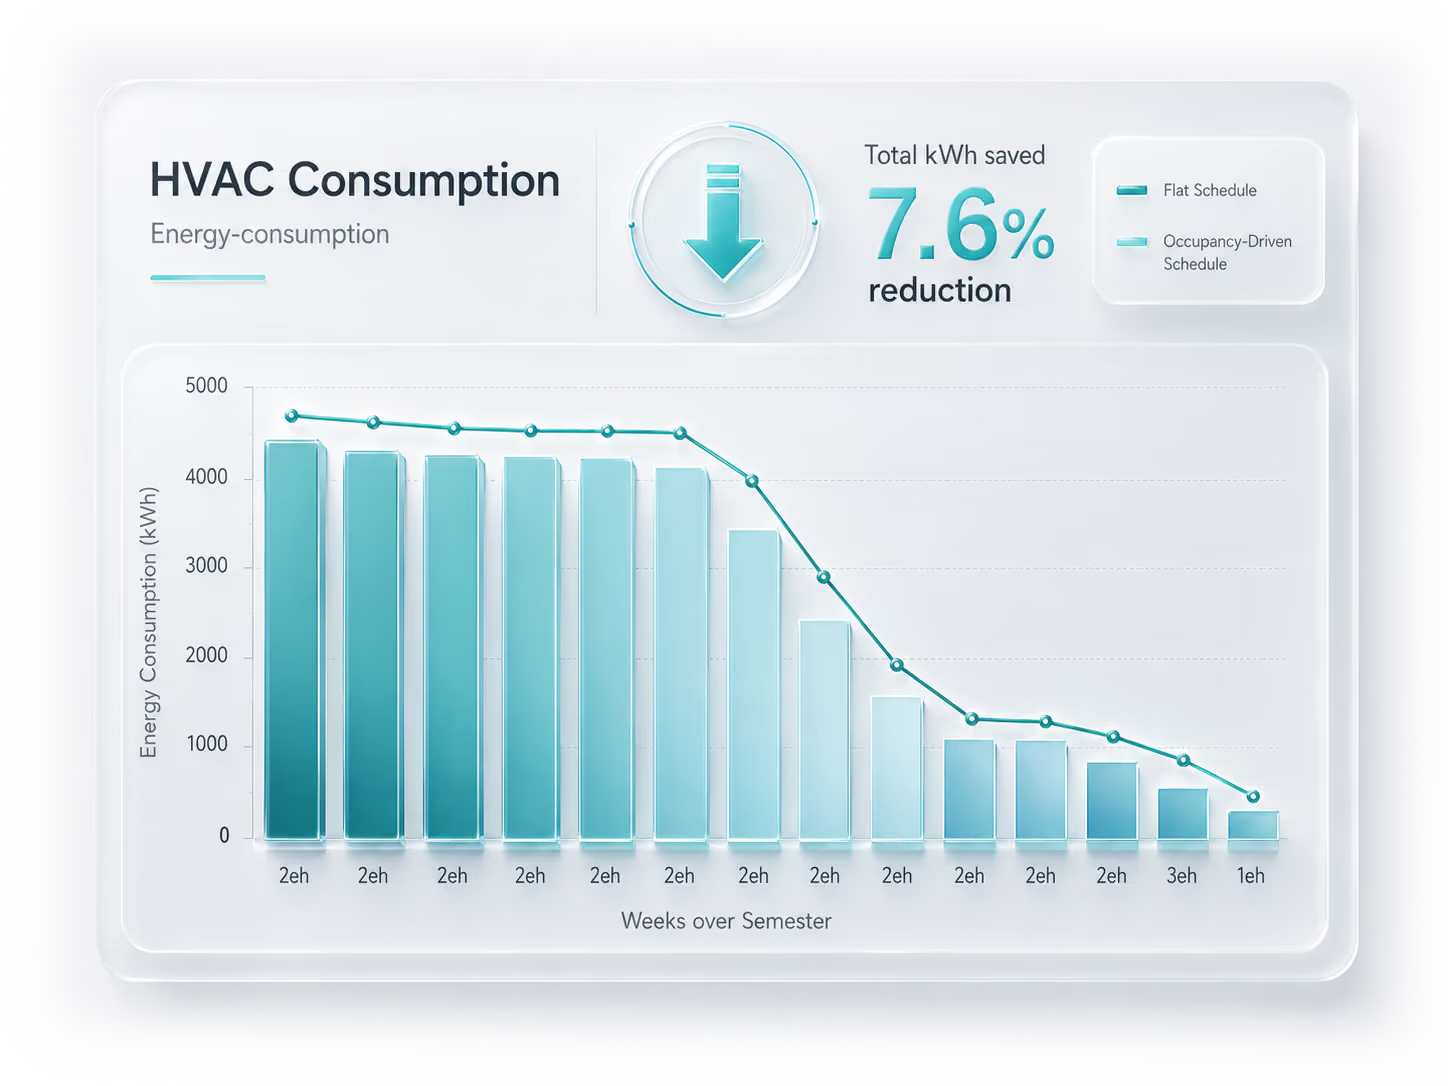
Many HVAC systems operate on schedules and occupancy assumptions rather than actual demand. Occuspace provides real-time occupancy data that can inform ventilation, temperature schedules and other building controls—reducing energy use when demand is low while supporting indoor air quality.
Real-time occupancy data for BMS integration
Demand-controlled ventilation strategies aligned with ASHRAE 62.1
Measurable energy and emissions reductions for sustainability reporting
HVAC energy consumption reduced with occupancy data
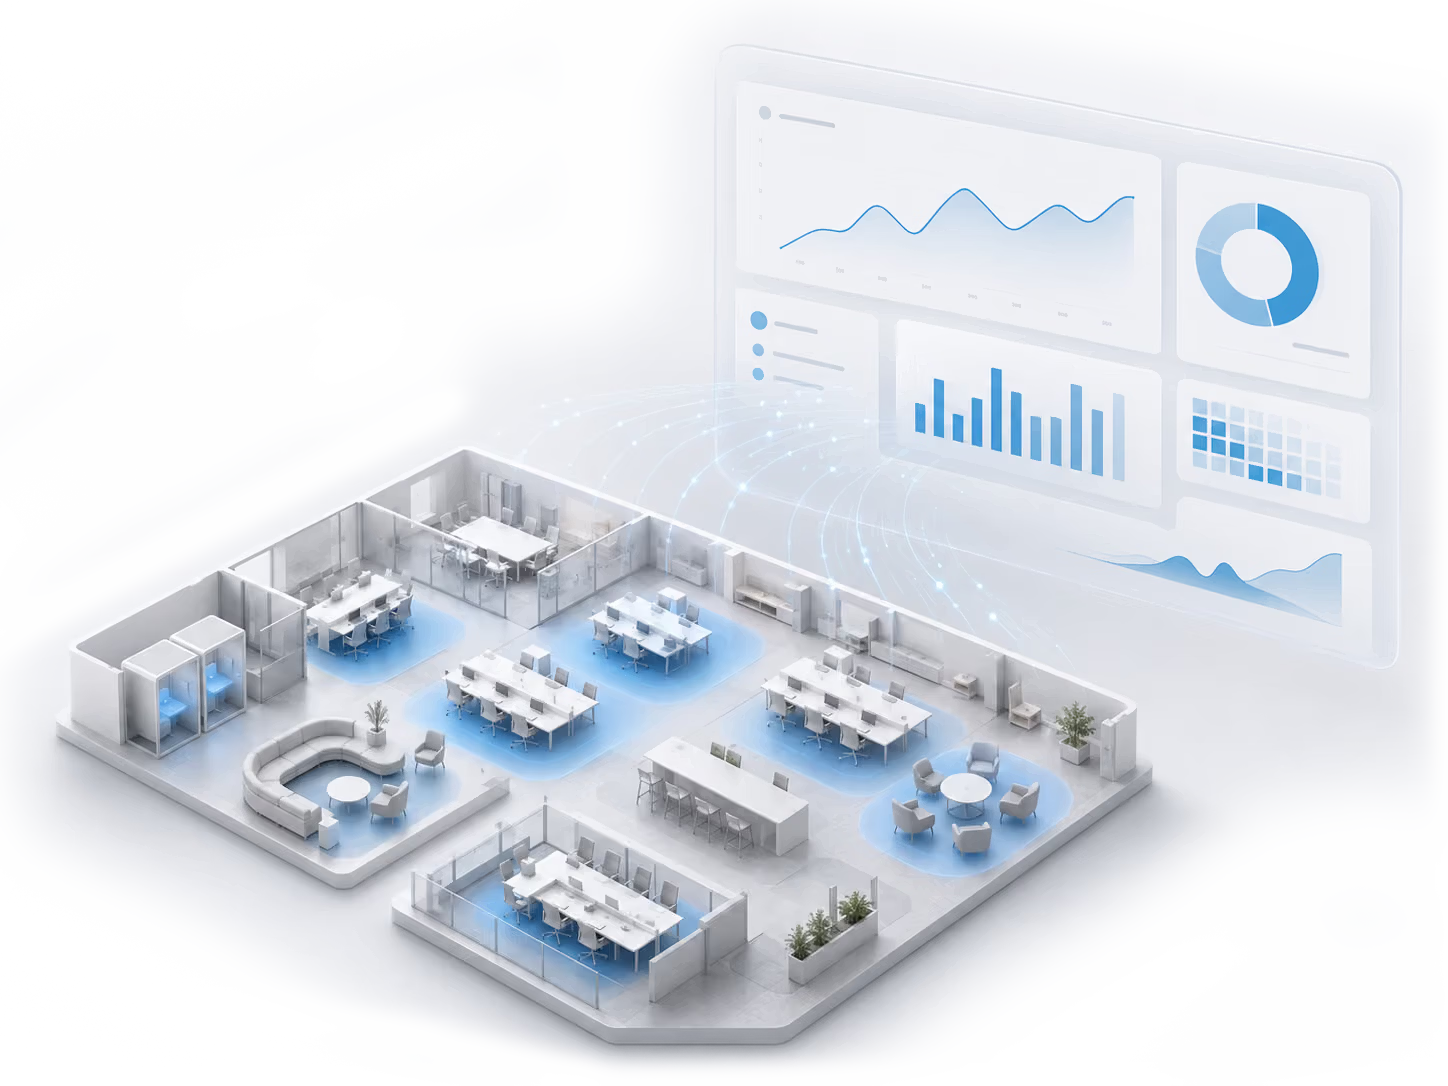
Occupancy dashboard showing zone-level usage for custodial planning
Operational Savings: Custodial

Match Cleaning to Actual Use

Fixed cleaning schedules often treat every space the same, regardless of how heavily it was used. Occupancy data helps teams adjust cleaning tiers, staffing and schedules based on actual traffic—focusing resources where they are needed while maintaining service standards.
Cleaning tiers based on measured traffic
Staffing and schedules aligned with actual demand
Zone-level data for in-house teams and service partners
See this in-depth case study webinar →
Operational Savings: Food Service

Match Food Service to Actual Demand

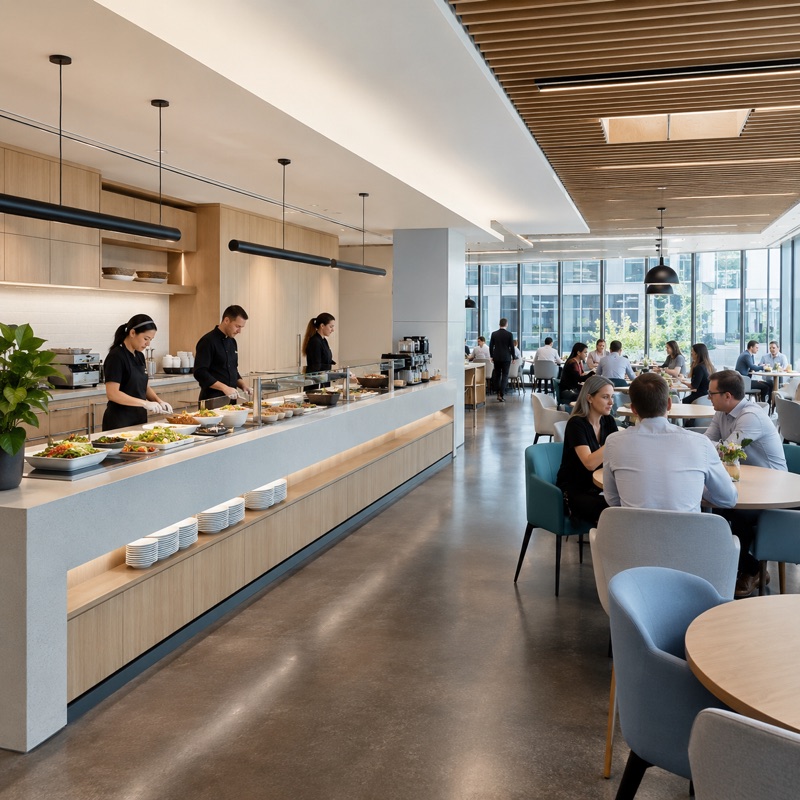
Daily attendance rarely follows a fixed forecast. Real-time occupancy data helps dining teams align food preparation, staffing and service with actual demand – reducing waste, controlling costs and improving the diner experience.
Daily production and staffing planned on real headcounts
Real-time insights into changing dining demands
Live busyness information so diners can avoid waits
Proof point: At one Food Service-operated site, occupancy-informed planning generated approximately $67,000 in annual savings.
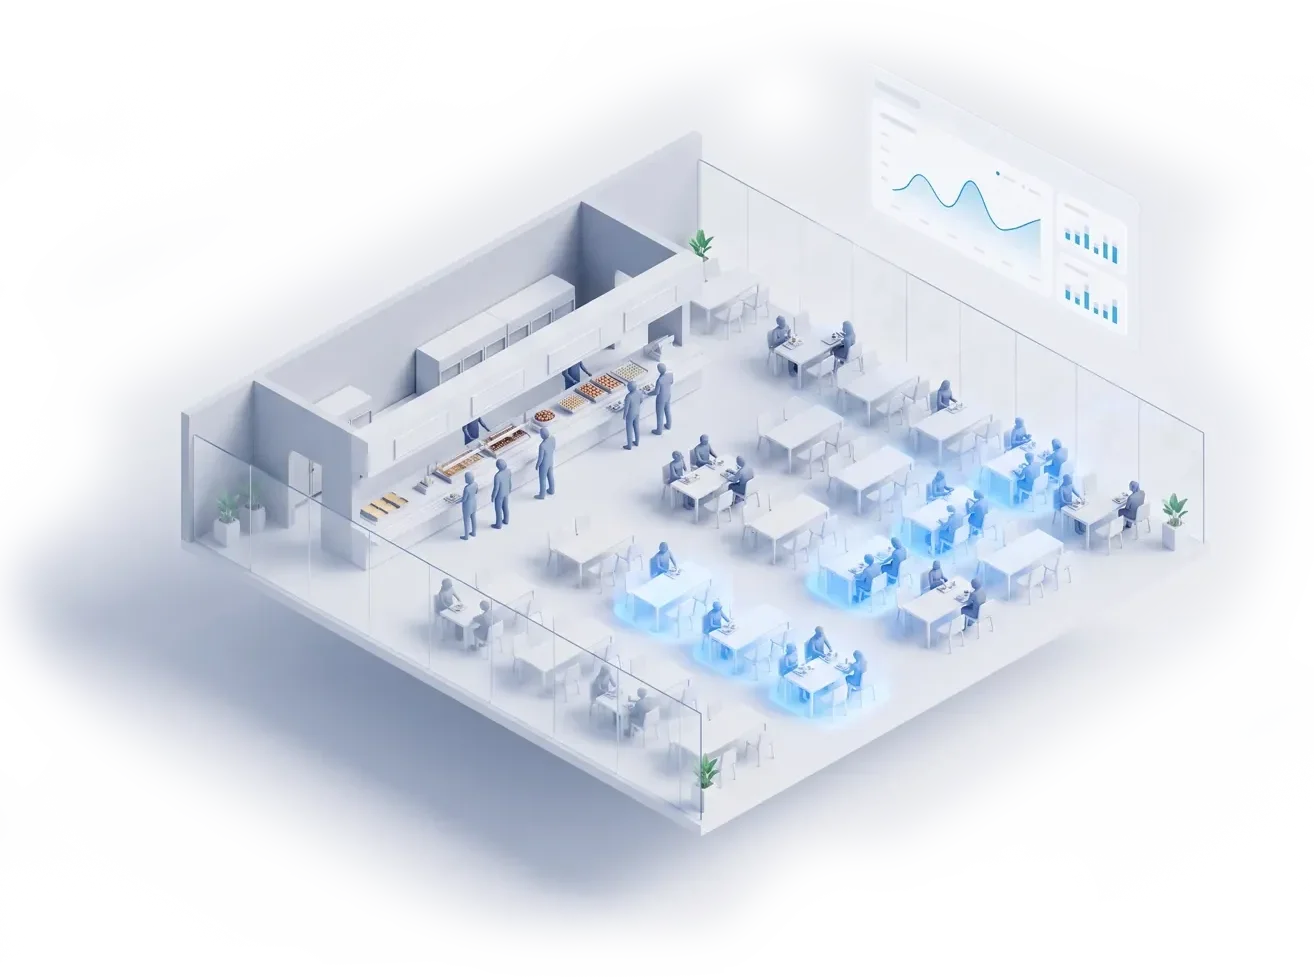
Students in a campus dining hall with live occupancy data

3

Capital Planning

Make smarter long-term real estate and investment decisions.
Data-driven Decisions

Ground Real Estate Decisions in Measured Demand

Major space decisions—whether to build, renovate, repurpose, lease or consolidate—require a clear view of long-term demand. Multi-year utilization trends reveal which spaces are consistently constrained and which are underused, helping teams compare options, prioritize investments and support recommendations with measured evidence.
Multi-year utilization trends by building and space type
Measured demand to inform build, renovate, lease or consolidate decisions
Decision-ready evidence for business cases, boards and capital committees
Campus buildings with multi-year utilization data
Portfolio occupancy dashboard for long-range planning
Portfolio Forecasting

Plan the Portfolio Around Real Demand

Long-range portfolio strategy runs on assumptions that quietly go stale. Continuous occupancy data keeps the plan honest: which locations to grow, which to consolidate, and when a lease or ownership decision is worth making. Every move is backed by how the portfolio is actually used, not a headcount snapshot from last quarter.
A consolidation and growth roadmap based on real use
Lease-versus-own decisions backed by occupancy trends
Year-over-year data to defend the long-range plan
AI-Ready Data

AI Is Only as Good as the Data You Feed It

AI is already reshaping real estate decisions, but its answers are only as reliable as the data behind them. Continuous occupancy measurement builds a consistent record of how spaces perform across days, seasons and years—giving AI and analytics tools a stronger foundation for forecasting, planning and automation.
Continuous measurement across your portfolio, not one-time samples
Historical patterns spanning days, seasons and years
Open API for BI, IWMS, BMS and AI integrations
Anonymous occupancy data with no PII
Explore the API
The Research

Real Numbers, From Real Buildings

None of this is theory. It is what operators, researchers, and our own index keep finding in the field.

Badge Data Misses by 25 to 40%

Badge swipes only capture who tapped in, not who is actually in the building. Measured against continuous occupancy data, badge counts routinely miss real presence by 25 to 40%.

$79 Billion in Unused Space

Occuspace's Fall 2025 Space Utilization Index covered 40+ million sq ft across 100+ campuses. Average utilization was 45%, and U.S. higher education spends an estimated $79 billion a year on space nobody uses.

Meeting Space Doesn't Match Demand

Small and medium conference rooms sit empty 73% of the work week, while the average meeting uses only 33% of available seats. Meetings of three to four people are most common, showing a clear need to better align room size, mix and allocation.

The Opportunity

These findings reinforce a clear conclusion: before organizations make any decision involving space, they need reliable evidence of actual demand. Continuous occupancy data helps leaders improve the spaces they have, align operations with real use and make more confident long-term investment decisions.
Measured Outcomes

From Clearer Data to Measurable Results

Across campuses, workplaces and government portfolios, customers use Occuspace to move from uncertainty to action—finding opportunities to reduce costs, improve space performance and make decisions with greater confidence.
30-40%
Typical real estate cost reduction
~20%
Custodial cost reduction at UCLA with tiered cleaning
$67K
Yearly food-waste savings at one Sodexo site
0
Cameras. Zero. Privacy-first always.
" We were paying for 40,000 sq ft more than we needed. Occuspace gave us 6 months of utilization data to bring into our lease renewal. We reduced our footprint, cut our real estate cost by 32%, and our employees actually use the space better now, because we redesigned it around what they actually do. "
VP, Corporate Real Estate
Global Technology Company
Watch the film
Technology
Solutions
Industry
News & Insights
Resources
Company
About Us
Contact
Careers